Fixed discrepancy between Dan’s and my limits, problem in Z+soft leptons

I found two sources of the discrepancy between Dan’s and my limits.  There was a problem with my signal modeling (I hadn’t included all of the available signal MC) and with Dan’s background modeling (he had too high of a QCD fraction.)  Also, I took out the ht cut that I added a while ago, since it actually gives a worse expected limit. (I had added it in an attempt to cut down some of the conversion background)

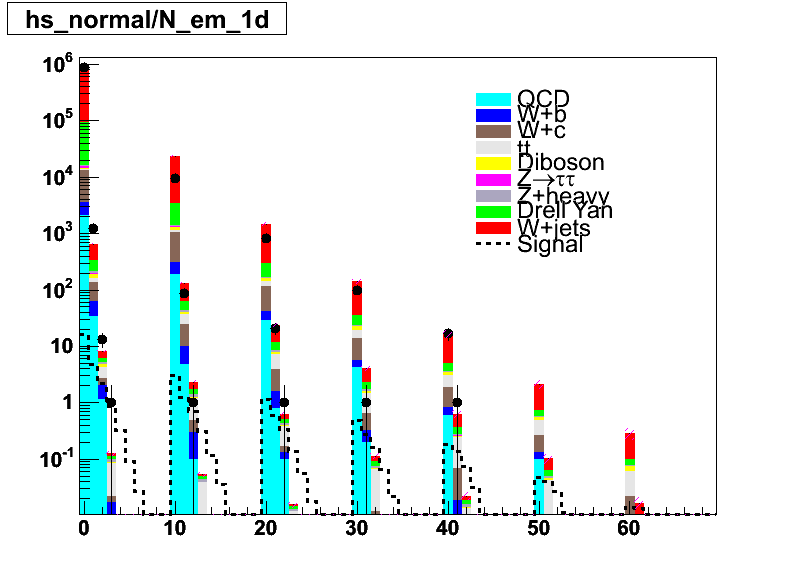
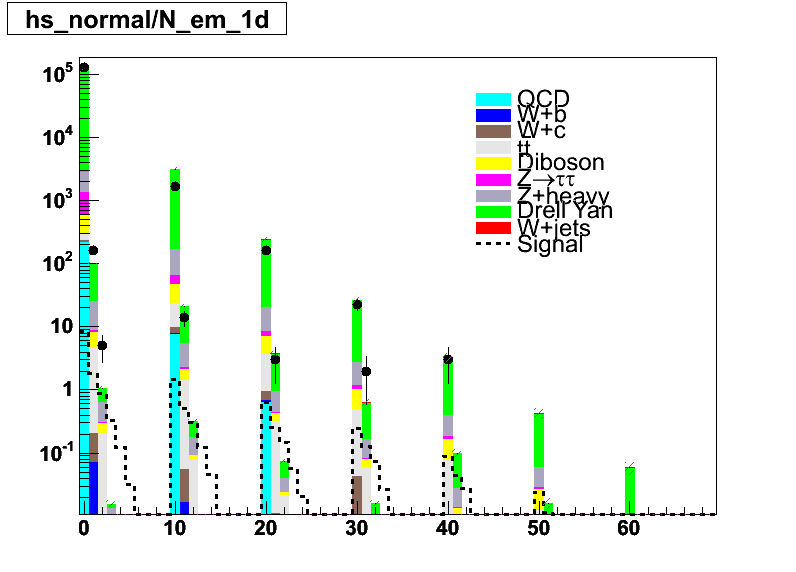
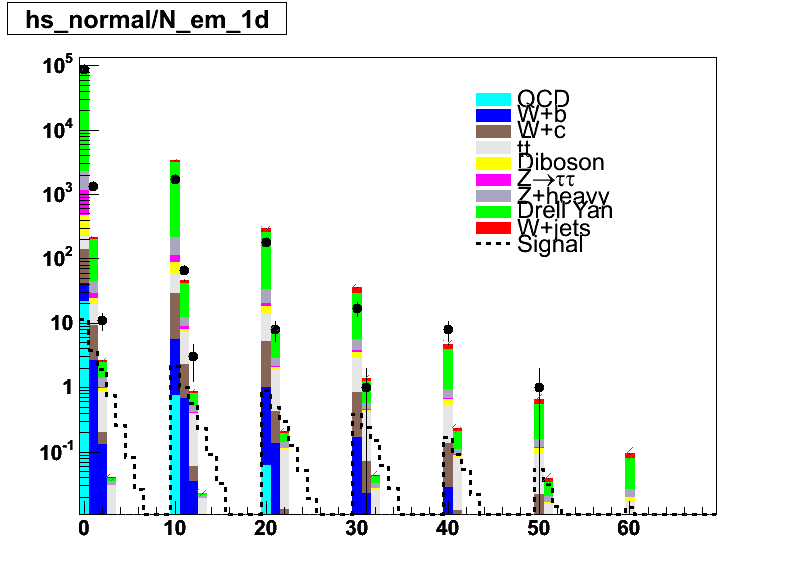
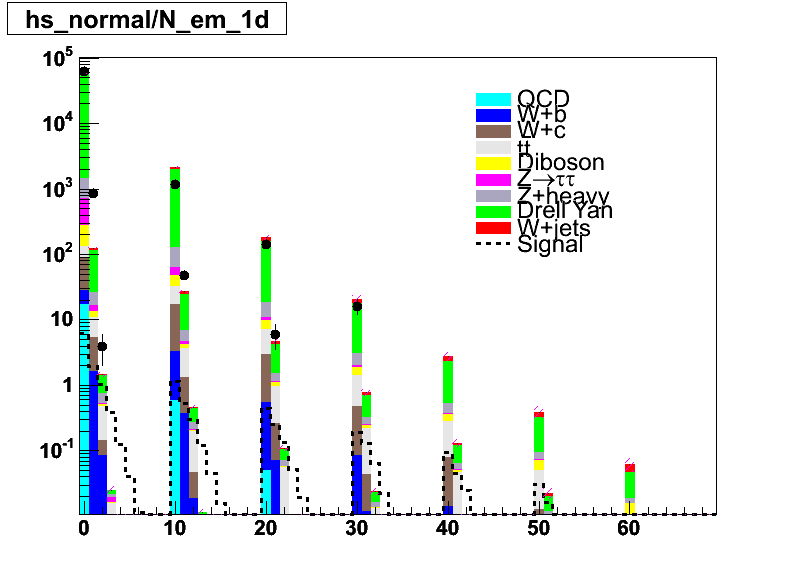
Here are my newest plots:

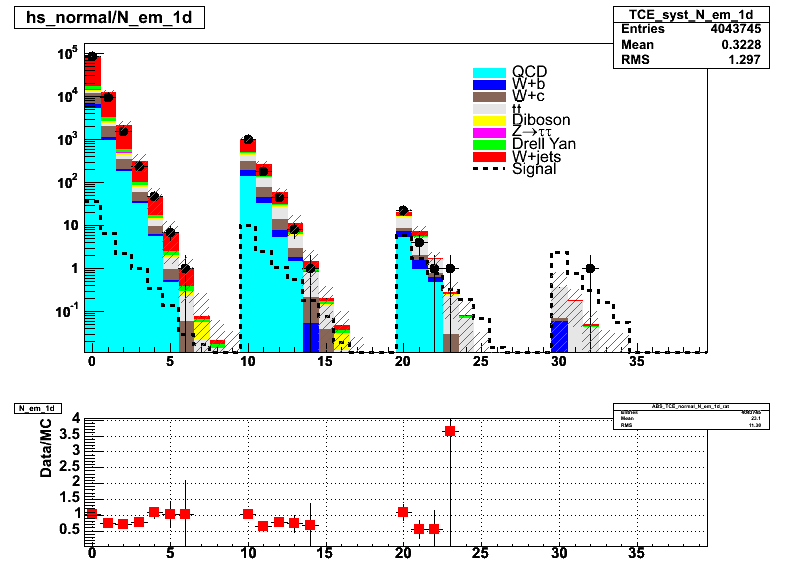
TCE W:

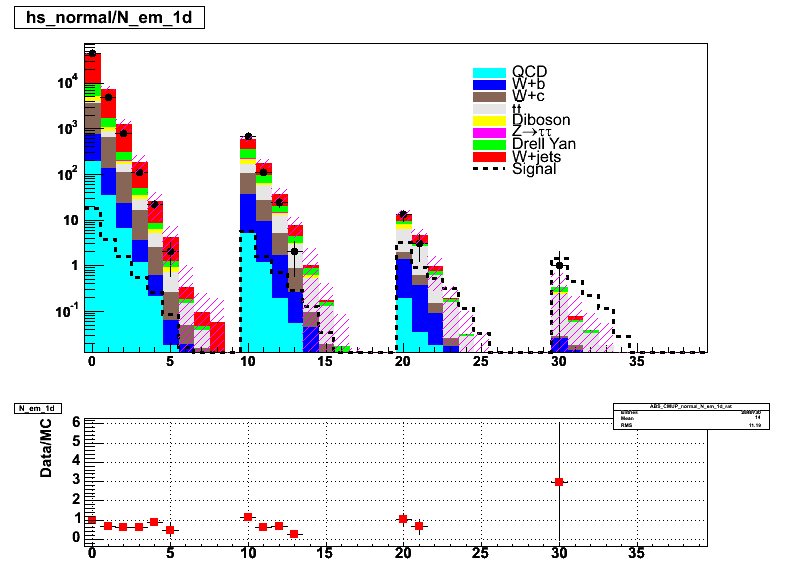
CMUP W:

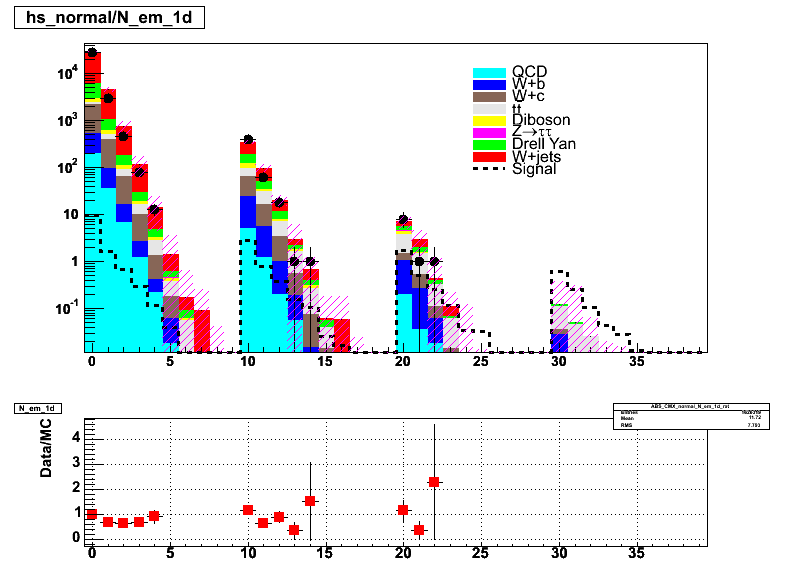
CMX W:

TCE Z:

CMUP Z:

CMX Z:

Clearly, there is a problem with the modeling in the Z channel. (It’s most noticable in the muon-triggered Z + 1 soft muon bin, where the background is low by a factor of 5.  Since this issue causes problems in mclimit, I’m currently only using the W channel to set a limit.  The limit is:

Observed : 0.439 +- 0.0000000
Expected : mean=0.273 +1sig=0.381 -1sig=0.209 +2sig=0.509 -2sig=0.180

If I include the Z, I get:

Observed : 0.532 +- -1.9805458
Expected : mean=0.216 +1sig=0.299 -1sig=0.164 +2sig=0.421 -2sig=0.137
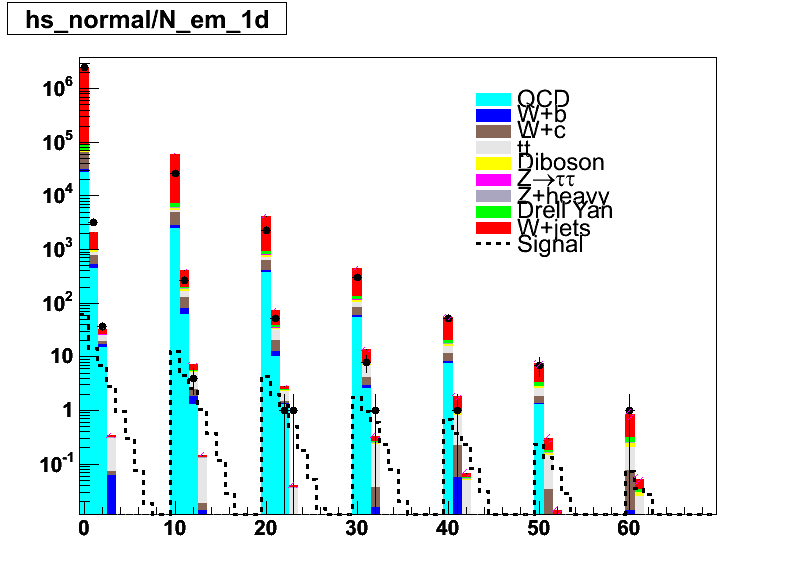
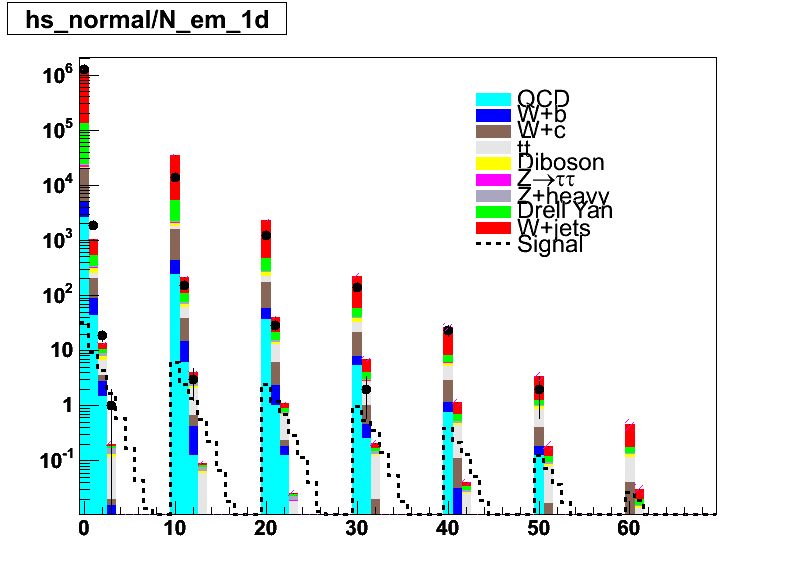
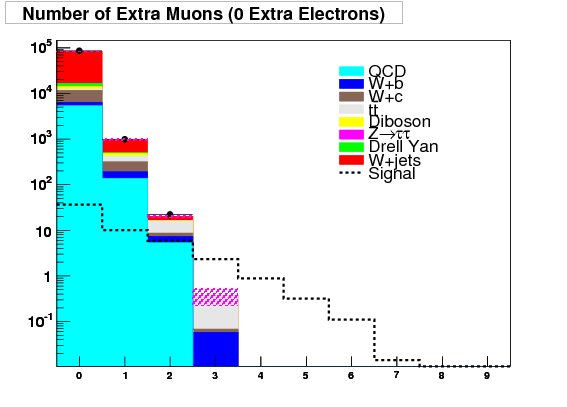
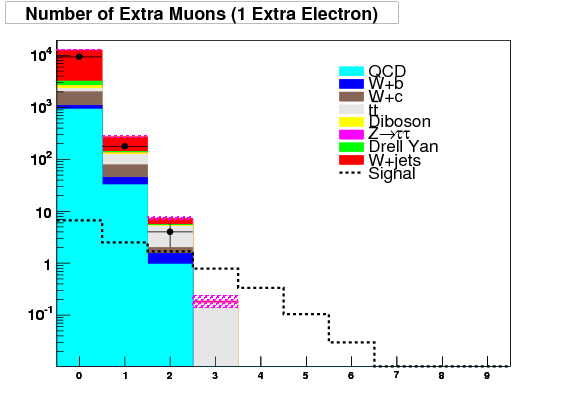
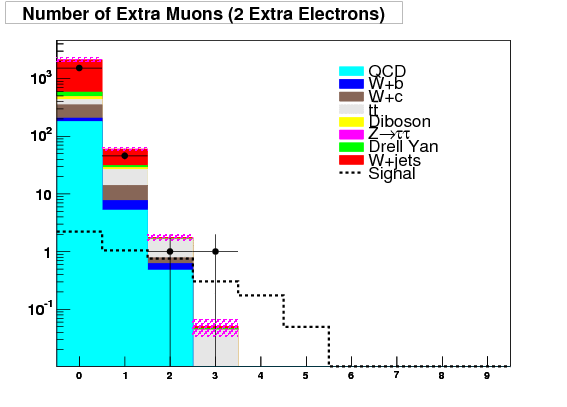
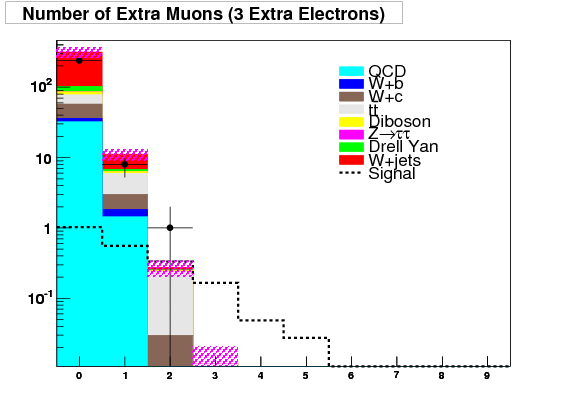
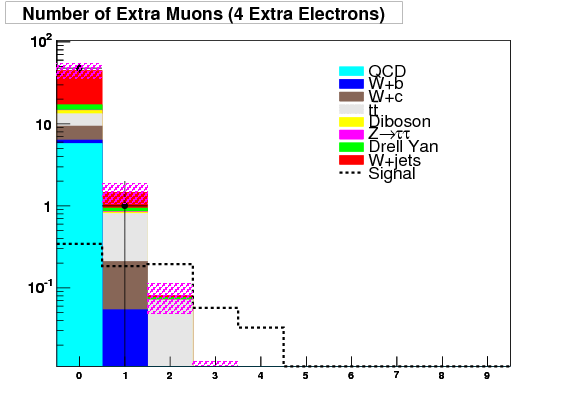
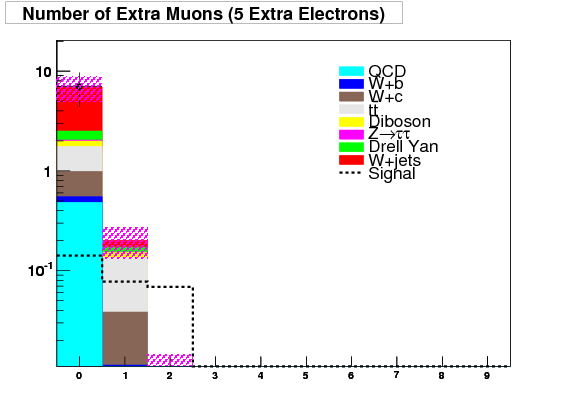
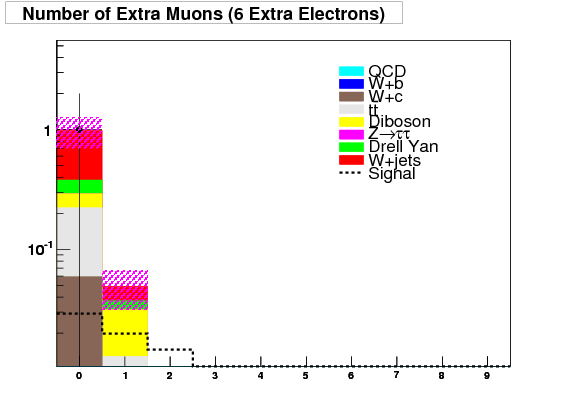
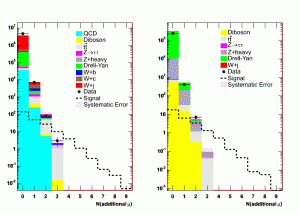
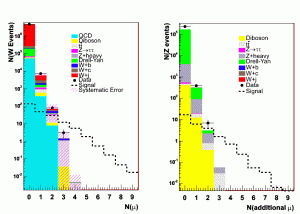
number of extra e’s and mu’s plots

With these current plots, I’m getting a worse limit than Dan has, even though he ignores the information from the electrons.  I’m currently running jobs to calculate the tag rates exactly, (as Dan does it) instead of throwing random numbers.  This should improve my systematics, but it also vastly increases the running time. (I have to go through all the combinations, so it runs in factorial time.  I could probably speed this up if some wants to prove that P==NP.)

W/Z Systematic Rate Variations and Bayesian Limit

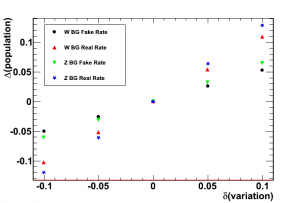
Using the exact weightings for the muon multiplicity distributions as described below, I made a plot of the change in the number of background events with respect to variations in the tag and fake rates.

Variations in the muon tag rate have more of a systematic effect on the background estimate than corresponding variations in the pion/kaon/proton mistag rates. In addition, the change in the number of background events is linear with respect to tag rate variations in all cases.

Next I take the 10% variations of both the real and fake rates and run a Bayesian limit calculator using 1000 pseudoexperiments drawn from the null hypothesis. We ask for 95% credibility level. The program returns the scale factor on the signal model that is excluded at this level. The output is as follows:

Observed : 0.305
Expected : mean=0.284 +1sig=0.396 -1sig=0.222 +2sig=0.589 -2sig=0.185

The observed exclusion is slightly stronger than expected, but completely within the 1 sigma bands. The signal model is excluded at 95% credibility at a cross-section of 30% of that provided.

Here are the plots of number of electrons and muons with systematics included.  The systematics include both a 10% error in the electron and muon tag rates and the uncertainty due to the random method I’m using to tag leptons.

TCE:

CMUP:

CMX:


-Scott

Weighted vs. RNG muon multiplicity

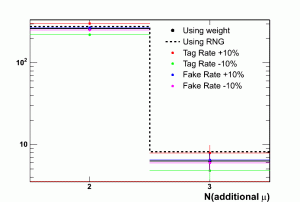
I think one of the problems with the limit setting that I attempted to do last week was that I was using a random number generator to decide if a particular MC soft muon candidate is tagged. In the tail of the multiplicity distribution where the yields are small, we can get incorrect systematic estimates this way due to random fluctuations. Below is a comparison of the number of events with 2 and 3 extra muons in a W+b MC sample between using and RNG and exact weighting.  The systematic yields are calculated using exact weighting while the central yields have both techniques.

The systematic variations are symmetric with respect to the exactly weighted central values while they are sometimes asymmetric with respect to the rng value. Using exact weights eliminates the false asymmetry.

Muon Multiplicity Distribution Using Single Soft Lepton Fit Results

After applying the extended soft muon matrices shown below and performing the pTrel/d0Sig fit, we fix the number of additional single soft muons to the results obtained from the fit and then take the absolutely normalized prediction as a systematic error for the higher multiplicity bins.  The result is shown below.

I ran a limit-setting program using the bins with N>1, taking the central value from the fit to the single lepton pTrel/d0Sig, and using the tag rate and fake rate variations as systematics. The CLs returned was 0.0714 with an expected value of 0.002. I am suspicious of this value because the Bayesian limit calculator failed using the same inputs. I have contacted the experts for advice.

Using Z Events to Extend Soft Muon Tag Rates

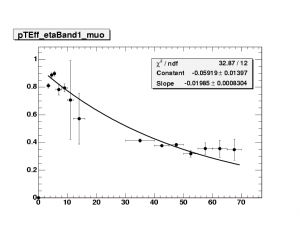
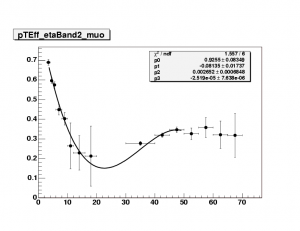
In the previous post, soft muon tag rates were extended into the pT>15 GeV region by plotting the efficiency as a function of pT for different eta bins and then taking the efficiency function as constant beyond the point for which there are no J/psi events.  An improvement on this is to use high-pT Z events to extend the efficiency function.

Below is the mass of trigger muon + taggable/tagged track for opposite-sign and same sign combination.

We can see that there is no Z peak in the same-sign data.  We use the same-sign as an estimate of the background under the Z peak, defined as 86.5<M(Z)<95.5 GeV.  We then obtain the efficiency as a function of pT in the same 3 eta bins as was done previously.

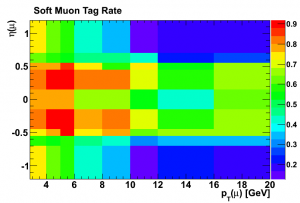
We use these functions to fill in missing bins for the muon tag rate matrix, as before.  The matrix obtained is:

We use this tag rate to obtain the absolute background prediction and pTrel/d0Sig templates.  We then use the results of the fit as an estimate of the systematic error for N(mu)>1.  The result is below.  Note that only the W has the systematic error currently estimated because the pTrel/d0Sig fit has not been performed for the Z events yet.

Extended Soft Muon Tag Rates

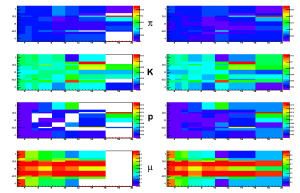
The tag/mistag matrices for soft muons had some holes in them due to insufficient statistics at higher pT in the J/psi, D*, and lambda samples.  I did a rough correction for this by fitting the efficiency as a function of pT in 3 eta bins for pions, kaons, protons, and muons separately and then using this fitted function whenever data was unavailable for a particular (pT,eta) bin of the matrix.  The result of this procedure is shown below.

The old tag rate matrix is on the left and the extended one is on the right.  Since we observed that the background prediction is low for the single muon bin and the data excess grows as a function of pTrel, I was hoping that filling these holes in the tag rates would fix some of this discrepancy.

The number of absolutely predicted SM background events in the single muon bin is now N(bg,W)=5386 for the W and N(bg,Z)=340.  Before the tag rate matrix extension, these numbers were N(bg,W)=5145 and N(bg,Z)=304.

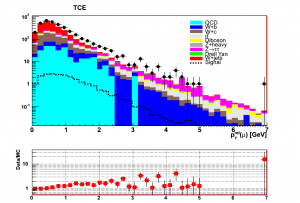
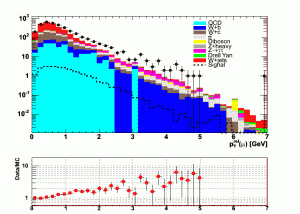
The pTrel plots now look like this.

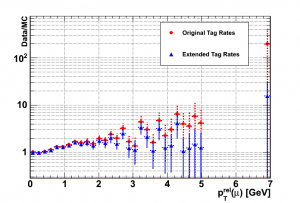
There is still an excess, but it climbs more slowly with respect to pTrel than before.  We can see this clearly if we compare the data/MC ratio plot to the one obtained before the tag rate extension.

Fixed DY Fraction In Single Muon Fit And Absolute Comparison

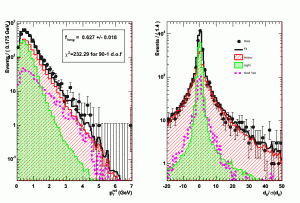
I am attempting to use the pTrel/d0Sig fit in the single muon bin either as a systematic or as a central result.  I fixed the Drell Yan fraction relative to the W+heavy component using the number obtained from the absolutely normalized sample,  15% for TCE.  The fit looks like this:

The fit output is as follows:

N(h)=1805 +- 50

N(DY)=319

N(l)=1262 +- 59

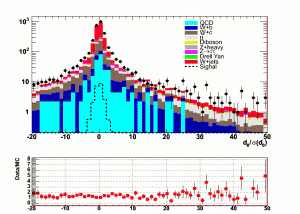
There is still a large discrepancy with the absolutely normalized result.  The corresponding absolutely normalized pTrel and d0Sig plots are below.

The numbers for this are:

QCD=303

W+b=198

W+c=537

tt=155

Diboson=49

Z+heavy=22

Z->tau tau=100

Drell Yan=36

W+jets=1497

Total background=2897

Total data=3494

Summing the contributions to compare to the fit, we get

N(heavy absolute)=890

N(DY absolute)=158

N(light absolute)=1849

There is twice as much heavy and Drell Yan from the fit and less light.  Also note that the absolute prediction is low by a factor of 20%.

Soft Muon Systematic Rate Variation

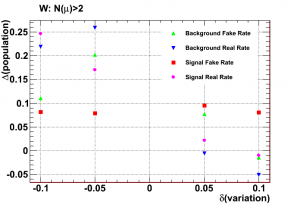
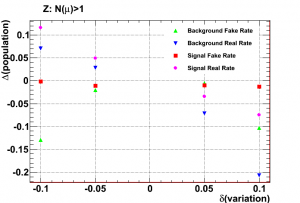
I varied the real and fake tag rates for soft muons for the standard model background and dark Higgs signal MC.  In addition, 5% of the taggable MC tracks were thrown away to model the 5% Monte Carlo tracking overefficiency systematic. I then plot the fractional change in background or signal population with respect to the variation for both the W and Z samples. The population plotted is the number of events containing 3(2) or more additional muons in the W(Z) sample.

Note that the signal MC tends to vary in the same direction as the background SM MC.  This implies the limit will be relatively stable with respect to a systematic variation in tag rate.

NMSSM Higgs Search