List of Systematics (v1)

Below is a first attempt at listing all of the systematic errors we need to calculate and proposed techniques for calculating them.

  • QCD rate – maximum variation found in CDF 6636 is 26% for N(jets)>3.  This may be overly conservative.
  • Lepton & trigger ID – can be obtained from the R-ratio as done by Sasha.
  • MC modelling for soft lepton ID – Some possibilities are
    • Use top selection. Take delta(1 mu) as a starting point for the uncertainty.  See if the difference changes as a function of N(mu) and blow up the error by this slope.
    • Do the single lepton fit using pTrel & S(d0).  Use this as a starting point for the uncertainty.  Blow up by Delta(Nmu) slope obtained from the top selection.
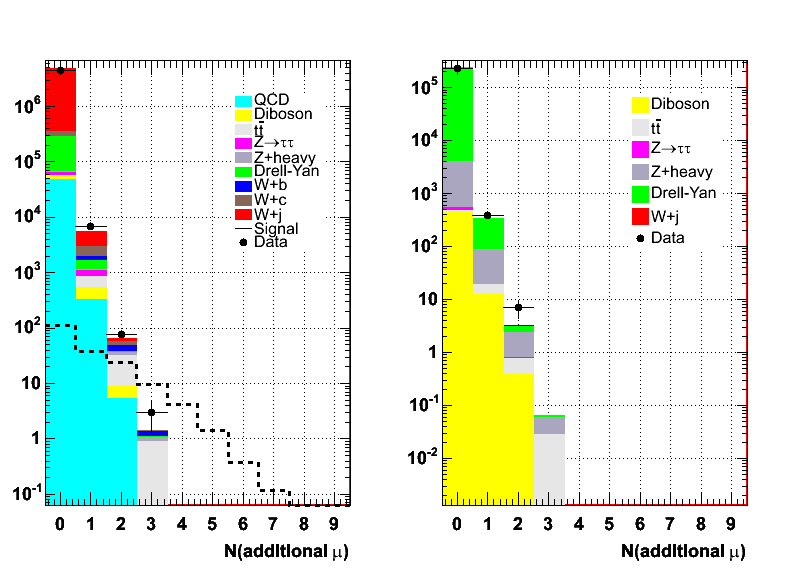
    • Take the maximum variation in N(taggable), pT(taggable), eta(taggable) in the single lepton bin and then feed the difference through the tag rate/mistag matrices.
    • There is expected to be a 5% tracking over efficiency in the MC.  Depending on how we estimate this uncertainty, it may be covered.  If it is not, I can throw out 5% of the tracks (possibly depending on pT) and rerun the prediction.
  • Soft muon tag rate –
    • propagate fit errors from J/psi.
    • fit epsilon(pT) in 2 bins of eta and vary fit function.
  • Soft muon mistag rate –
    • take largest (Observed-Predicted)/Observed from various jet samples.

Fix additional lepton counting and some Z issues

Last week, I produced “final” 4 panel plots combining all the triggers for W and Z selections.  Here is the 4 panel Z plot I showed last week

There are 2 issues with this plot:

  1. The jet overlapping the 2nd loose lepton is not being removed from the jet list.  This causes the funny bump in the Et(jet) plot in the bottom right.
  2. All of the plots are for dilepton events across the whole mass spectrum.  We should be plotting the Z region, since this is “W/Z + additional leptons”.

Both of those issues were fixed this week to give the following plot. Note that the mass plot still shows the whole range.

The other plot produced last week was the N(muons) plot, shown below.

There are 2 issues with this plot as well:

  1. The count of muons in the Z plot is over the entire mass region, as above.
  2. We are counting muons coming from the W and Z as well.  This causes weird shapes because we are combining electron and muon triggers.

We fix these issues by, as above, only counting inside the Z window and by ignoring leptons coming from the W or Z.  In addition, the signal expectation is added.  The new plot is below.


Discrepancy Between Absolute Normalization and Fit Result in Single Muon Bin

The absolutely normalized prediction for the heavy component of the single muon final state and the fit results differ widely.  Below are pTrel and d0 significance plots obtained from absolute normalization.

And here is a corresponding fit result for mu+.

The fit returns N(W+heavy)=1861 +- 65 while the absolute prediction is 897.  The reason for this may become apparent when we plot some of the absolutely normalized components below.

Continue reading Discrepancy Between Absolute Normalization and Fit Result in Single Muon Bin

Muon Multiplicity Distribution w/ Signal Expectation

Below is the plot of the muon multiplicity distribution in the TCE trigger with the Dark Higgs signal model overlaid.  Note that this distribution is the sum of soft and hard muons.

The number of events with >2 muons predicted and observed are:

N(SM bg)=0.688; N(Dark Higgs)=7.6; N(data)=1

Dimuon Predicted & Observed Using W+jets for Heavy Ratios

Following Scott’s discovery of the discrepancy in the single lepton population between the W+jets & W+heavy samples, I below used the heavy ratios obtained from the W+jets samples to obtained the predicted background and compared to the observed yield.

TCE mu+ mu+:

#mu^{+}_{l}#mu^{+}_{l}=0.443923

#mu^{+}_{l}#mu^{+}_{h}=0.106633

#mu^{+}_{h}#mu^{+}_{h}=1.36741

nbg=1.91797

data=9

TCE mu+ mu-:

#mu^{+}_{l}#mu^{-}_{l}=3.10351

#mu^{+}_{l}#mu^{-}_{h}=0.461862

#mu^{+}_{h}#mu^{-}_{l}=0.258485

#mu^{+}_{h}#mu^{-}_{h}=10.282

nbg=14.1059

data=23

TCE mu- mu-:

#mu^{-}_{l}#mu^{-}_{l}=0.971373

#mu^{-}_{l}#mu^{-}_{h}=0.365418

#mu^{-}_{h}#mu^{-}_{h}=0.549428

nbg=1.88622

data=8

CMUP mu+ mu+:

#mu^{+}_{l}#mu^{+}_{l}=0.399164

#mu^{+}_{l}#mu^{+}_{h}=0.0449528

#mu^{+}_{h}#mu^{+}_{h}=2.32589

nbg=2.77001

data=5

CMUP mu+ mu-:

#mu^{+}_{l}#mu^{-}_{l}=1.91507

#mu^{+}_{l}#mu^{-}_{h}=0.573502

#mu^{+}_{h}#mu^{-}_{l}=0.173787

#mu^{+}_{h}#mu^{-}_{h}=4.48139

nbg=7.14375

data=16

CMUP mu- mu-:

#mu^{-}_{l}#mu^{-}_{l}=0.634605

#mu^{-}_{l}#mu^{-}_{h}=0.0522837

#mu^{-}_{h}#mu^{-}_{h}=2.67786

nbg=3.36475

data=2

CMX mu+ mu+:

#mu^{+}_{l}#mu^{+}_{l}=0.168544

#mu^{+}_{l}#mu^{+}_{h}=0.201404

#mu^{+}_{h}#mu^{+}_{h}=0.294008

nbg=0.663956

data=0

CMX mu+ mu-:

#mu^{+}_{l}#mu^{-}_{l}=1.2084

#mu^{+}_{l}#mu^{-}_{h}=0.0506138

#mu^{+}_{h}#mu^{-}_{l}=0.011716

#mu^{+}_{h}#mu^{-}_{h}=3.07523

nbg=4.34596

data=6

CMX mu- mu-:

#mu^{-}_{l}#mu^{-}_{l}=0.341453

#mu^{-}_{l}#mu^{-}_{h}=0.292227

#mu^{-}_{h}#mu^{-}_{h}=0.382209

nbg=1.01589

data=2

We have gone from having an observed excess everywhere to having an observed deficit almost everywhere.

Newest expected/observed numbers

After speaking with Henry  on Friday, I’m using the W+jets instead of W+heavy samples to get the 2-to-1 soft lepton ratios.  Here’s the newest table:

Category Expected Observed
DILEP_TCE_eP_eP 339.107 378
DILEP_TCE_eP_eN 702.108 737
DILEP_TCE_eN_eN 357.002 342
DILEP_CMUP_eP_eP 192.871 242
DILEP_CMUP_eP_eN 402.9 479
DILEP_CMUP_eN_eN 205.709 259
DILEP_CMX_eP_eP 119.375 126
DILEP_CMX_eP_eN 236.311 301
DILEP_CMX_eN_eN 114.012 152
DILEP_TCE_eP_mP 34.9529 19
DILEP_TCE_eP_mN 34.5579 26
DILEP_TCE_eN_mP 33.7819 34
DILEP_TCE_eN_mN 38.8574 27
DILEP_CMUP_eP_mP 18.4859 12
DILEP_CMUP_eP_mN 17.1124 23
DILEP_CMUP_eN_mP 19.8476 15
DILEP_CMUP_eN_mN 19.6184 13
DILEP_CMX_eP_mP 10.6777 13
DILEP_CMX_eP_mN 12.6213 7
DILEP_CMX_eN_mP 8.30193 10
DILEP_CMX_eN_mN 10.0776 9

The numbers are much closer than they were before, but there are still issues to fix:

  • The e+mu predictions seem too high, (at least in the TCE trigger) and I just fixed a problem that will, I expect, increase them further.
  • I believe the expected contribution from two conversion electrons is still two low:

  • The soft electron parameterization needs to be tweaked (or I could just cut off the soft electrons at 1.5 GeV):

-Scott

The reason the predictions are high in the 2-lepton categories

I’ve found the reason the predictions are high in the 2-lepton categories.  The problem is in the 2-lepton to 1-lepton ratios, but I’m not sure how to fix it.

In order to calculate the expected contribution from a particular 2-lepton process, say e+ from a heavy jet and e- from a light jet (abbreviated ePh and eNl) we find N(ePh)_data from the pTrel/d0 fit, and multiply that by the ratio found in the MC: N(ePh + eNl)/N(ePh)

N(ePh)_data * N(ePh + eNl)_MC / N(ePh)_MC = N(ePh + eNl)_predicted

Currently, we’re using the W+heavy MC to calculate N(ePh + eNl)_MC / N(ePh)_MC.  Naively, I would expect that using the W+jet MC would give the same answer, but with larger error bars, since there is some W+heavy in the W+jet sample.  However, as it turns out, the two samples give a ratio that differs by a factor of two.  They agree on the number of expected ePh + eNl events, but the W+jet has significantly more ePh events. (remember that the categories are exclusive)

In the following plots, the X-axis is the number of e+ from heavy jets in the event, and the Y-axis is the number of e- from light jets.  Look at the (1,1) and (1,0) bins.  The top plot is W+jets, and the bottom one is W+heavy.

The N(ePh) is twice as large in the W+jets sample as in the W+heavy sample.  We’re currently using the W+heavy numbers in our calculations, (on the assumption that the error bars would be smaller) but the W+jets numbers seem to agree better with the data.  Is there a reason the two should be so wildly discrepant?

-Scott

First Look At Dark Higgs Monte Carlo

We have successfully generated a test sample of Dark Higgs MC according to the prescription given by Matt Reece.  The decay chain is WH->e nu chi0 chi0, where chi0 is the SUSY LSP.  The chi0’s then decay through the dark sector as chi0->chiD N(aD) where chiD is the dark photon, aD is the dark pseduscalar Higgs, and N can range from 2 to 4.  The dark Higgseses then decay to two electrons or two muons.

The model parameters used in this generation are as follows:

M(H)=120 GeV

M(chi0)=10 GeV

M(chiD)=1 GeV

M(aD)=300 MeV

Br(chi0->chiD aD aD)=0.333

Br(chi0->chiD aD aD aD)=0.333

Br(chi0->chiD aD aD aD aD)=0.333

Br(aD->ee)=0.525

Br(aD->mu mu)=0.466

Br(aD->pi pi)=0.009

There are other SUSY model parameters that are not listed above.

The plots below compare the shape of the electron and muon multiplicity distributions for the Dark Higgs with respect to Standard Model W+heavy jet production.  These plots are normalized to unit area.

Clearly, the lepton multiplicity in this Dark Higgs model is much higher than in SM W+heavy jets.

New Predictions

Here are the new expected and observed numbers in e+e and e+mu:

Old Track Quality:

Selection BG Prediction Data Observed
TCE_eP_eP 550.536 469
TCE_eP_eN 1122.09 901
TCE_eN_eN 583.46 428
CMUP_eP_eP 331.307 302
CMUP_eP_eN 675.02 563
CMUP_eN_eN 342.74 315
CMX_eP_eP 189.794 170
CMX_eP_eN 366.203 361
CMX_eN_eN 185.485 201
TCE_eP_mP 65.4135 19
TCE_eP_mN 63.8633 26
TCE_eN_mP 58.6098 36
TCE_eN_mN 64.9233 30
CMUP_eP_mP 32.5401 12
CMUP_eP_mN 30.2969 24
CMUP_eN_mP 31.4779 16
CMUP_eN_mN 32.2473 14
CMX_eP_mP 16.3119 14
CMX_eP_mN 20.3123 8
CMX_eN_mP 15.8709 12
CMX_eN_mN 22.3682 13

New Track Quality: (tighter silicon requirements for electrons)

Selection BG Prediction Data Observed
TCE_eP_eP 460.208 378
TCE_eP_eN 1011.86 737
TCE_eN_eN 537.621 342
CMUP_eP_eP 297.91 242
CMUP_eP_eN 612.326 479
CMUP_eN_eN 306.243 259
CMX_eP_eP 177.752 126
CMX_eP_eN 350.248 301
CMX_eN_eN 171.667 152
TCE_eP_mP 55.1458 19
TCE_eP_mN 59.1393 26
TCE_eN_mP 54.0227 34
TCE_eN_mN 59.9562 27
CMUP_eP_mP 29.1257 12
CMUP_eP_mN 28.783 23
CMUP_eN_mP 29.4332 15
CMUP_eN_mN 28.9681 13
CMX_eP_mP 14.4311 13
CMX_eP_mN 20.0945 7

The most dramatic change between these two was the reduction in the predicted contribution from (e+e-, both from conversions).  That contribution was reduced by a factor of two, but that’s the one that we aren’t currently getting a good estimate for. (a reduction from 12 to 6 doesn’t show up very well)

-Scott

NMSSM Higgs Search