Given data in a file that looks like this (iperf.dat):
0	893	890	963	960	960	962
2	881	881	936	943	946	938
4	892	860	941	944	938	942
6	880	878	945	943	942	941
8	872	868	936	941	943	934
10	878	881	944	942	941	945
12	881	867	943	938	940	944
14	884	877	939	940	942	942
16	868	879	941	941	944	938
18	882	895	942	943	937	942
20	883	885	937	944	946	943
22	891	888	940	943	937	942
24	897	878	942	939	947	941
26	883	866	946	938	935	938
28	887	883	943	941	945	947
30	881	877	941	944	946	936
32	896	875	940	840	934	949
34	883	888	939	928	945	937
36	875	892	932	939	944	941
38	871	882	941	941	940	943
40	897	886	940	947	938	943
42	889	894	940	936	943	938
44	897	885	940	947	944	943
46	887	892	949	936	940	945
48	891	879	940	942	937	936
50	883	893	935	942	944	946
52	892	884	941	942	945	937
54	897	899	940	944	943	943
56	890	891	941	940	936	944
58	886	883	948	941	941	940
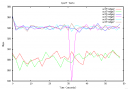
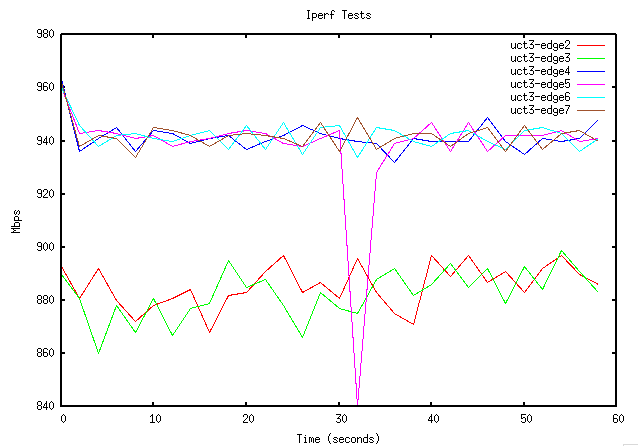
Can use gnuplot to make a plot. First make a plot file (iperf.p) with the commands want:
set title "Iperf Tests"
set xlabel "Time (seconds)"
set ylabel "Mbps"
plot \
"iperf.dat" using 1:2 title 'uct3-edge2' with lines, \
"iperf.dat" u 1:3 t 'uct3-edge3' w lines, \
"iperf.dat" u 1:4 t 'uct3-edge4' w lines, \
"iperf.dat" u 1:5 t 'uct3-edge5' w lines, \
"iperf.dat" u 1:6 t 'uct3-edge6' w lines, \
"iperf.dat" u 1:7 t 'uct3-edge7' w lines
Start gnuplot and load the plotfile.
pong:Desktop maryh$ gnuplot

	G N U P L O T
	Version 4.2 patchlevel 2
	last modified 31 Aug 2007
	System: Darwin 9.1.0

	Copyright (C) 1986 - 1993, 1998, 2004, 2007
	Thomas Williams, Colin Kelley and many others

	Type `help` to access the on-line reference manual.
	The gnuplot FAQ is available from http://www.gnuplot.info/faq/

	Send bug reports and suggestions to


Terminal type set to 'x11'
gnuplot> load 'iperf.p'
Resulting plot: